
Python代码实践|随机森林是“黑盒子”?不存在的,撸完代码你就懂了
动机: 随机森林集成的广泛应用在实际的问题中,既有分类也有回归。它们的热门可以归功于使用随机森林方法使用者只需要很少的数据清洗,不需要进行特征的缩放,就可以得到最优的结果。为了更好的理解背后的原理,我决定从头实现一个随机森林,然后在数据的不同的特征上进行一些可视化,看看这些特征在决定最终结果中扮演了什么样的角色。人们常常认为随机森林是个黑盒子,但是简单的过一遍这个算法,就会发现,这除了是一个利用“多数投票”方法的强大的技术外,实际上可解释性还是挺强的。
介绍
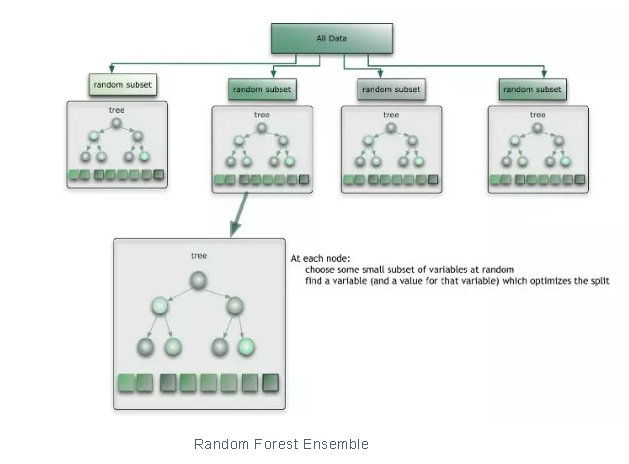
随机森林集成是一个分而治之的方法,用来提高单个弱决策树模型的能力。背后的主要原则是通过一组“弱学习器”,组合起来形成一个“强学习器”。每个分类器都是一个独立的“弱学习器”,所有的分类器一起组成一个“强学习器”。
随机森林集成
随机森林的核心概念就是对一些决策树的结果取平均。随机森林是对那些不熟悉机器学习的人解释预测背后的直觉的一个常用的工具。但是解释随机森林如何得到这个预测,使用哪些特征或者独立变量,还是个麻烦事。随机森林常常被错误的解释为一个“黑盒子”,很难理解。
用Python写一个随机森林
下面是一个从头写随机森林代码和优化的练习,可以增进对随机森林的深入理解。我们还会看看,如何理解给定的特征的权值是如何给到的,为什么这么设置,为什么不用其他的特征来预测结果。
随机森林和决策树类
在Python中使用面向对象编程,定义一个类RandomForest,包含了DecisionTree的对象。随机森林基本上就是做一个收集和平局的计算,每一个核心方程使用决策树来构造。
class RandomForest:
    def __init__(self, sample_size, n_trees = 10 , min_samples_leaf = 5, max_depth = 4, max_features = None):
        self.n_trees, self.sample_size , self.min_samples_leaf, self.max_depth, self.max_features = n_trees, sample_size, min_samples_leaf, max_depth, max_features
        self.trees = [self.create_tree() for _ in range(self.n_trees)]

    def create_tree(self):

        return DecisionTree(min_samples_leaf = self.min_samples_leaf, max_depth = self.max_depth, max_features = self.max_features)

    def fit(self, X, y):
        #calls the var_split method of underlying Decision Trees
        for tree in self.trees:
            random_idxs = np.random.permutation(X.shape[0])[:self.sample_size]
            tree.var_split(X.iloc[random_idxs, :], y[random_idxs])

    def predict(self, x):
      #  average of the predictions from each tree

        return np.mean([t.predict(x) for t in self.trees], axis = 0)

    def plot_pdp(self, X, y, feature_name, n_clusters = 0): pass

    def plot_pdp(self, X, y, feature_names, n_clusters = 0): pass
The Random Forest class
class DecisionTree:

    def __init__(self, int min_samples_leaf = 3, int max_depth = 4, int level = 0, max_features = None, float parent_value = float('inf')):
        #initialize Decision Tree

    @property
    def is_leaf(self):
        #a node is a leaf if its score is equal to infinity

    def find_better_split(self, x, y, int ind):

        """logic to find the best value to split the tree
        on for a particular feature"""

    def var_split(self, x, y):

      """logic to find the best feature to split the tree on, and
      its optimum value for the split"""

    def predict_row(self, row):
        """logic to predict the result for
        a single data sample (row) in the
        test / validation set"""

    def predict_row_for_ti(self, row, feat_contribs):
        #functionality for Tree Interpreter

    def predict(self, X):
        y_pred = []
        for row in range(X.shape[0]):
            y_pred.append(self.predict_row(X.iloc[row, :]))
        return y_pred

    def get_prediction_and_bias(self):
         #returns the prediction of this tree and bias ( the value at the root )

    def get_child_trees(self):
        return self.leftTree, self.rightTree

    def __repr__(self):
return "score: " +str(self.score) + " avg: "+str(self.value) + " split val: " + str(self.split_val) + " split feature : "+ str(self.split_feature)tTree.predict_row_for_ti(row, feat_contribs)构造器(init),输入参数包括每棵树的样本数量,每棵树分到的最大特征数量,目的是为每棵树注入随机性,移除预测的偏差。输入参数还包括一些随机森林算法用到的其他的超参数。
拟合函数实现了关键的功能,使用训练数据构建随机森林中的每棵树。
预测方法实现了对测试数据进行每一棵树的预测和平均的功能,得到测试数据的最终的结果。
训练模型的逻辑流程
Random Forest类中的fit()方法用来训练模型,调用了 Decision Tree 类中的varsplit()函数,又在循环中调用了 findbetter_split()。这样构造了随机森林中的每一个决策树成员,对每棵树使用训练数据进行拟合。
def var_split(self, x, y):

        if x.shape[0] > self.min_samples_leaf and self.level < self.max_depth - 1:
            #keep traversing till conditions for a leaf node are met
            if self.max_features is not None:
                if self.max_features in ['auto', 'sqrt']:
                    self.max_features = int(math.sqrt(x.shape[1]))
                else:
                    if self.max_features == 'log2':
                        self.max_features = int(np.log(float(x.shape[1]))/np.log(2))
                    else:
                        if isinstance(self.max_features, float):
                            self.max_features = int(self.max_features * x.shape[1])
                        else:
                            self.max_features = x.shape[1]
            else:
                self.max_features = x.shape[1]
            self.max_features = int(self.max_features)
            feature_inds = np.random.permutation(x.shape[1])[:self.max_features]
            #iterate over all features
            feature_inds = [index for index in feature_inds if x.columns[index] != None]
            for ind in feature_inds:
                self.find_better_split(x, y, ind)
           #finds best feature to split on
            if self.parent_value == float('inf'):
                self.parent_value  = self.value
            x_lhs, x_rhs = x.iloc[:self.split_val,:], x.iloc[self.split_val:,:]
            self.leftTree = DecisionTree(min_samples_leaf = self.min_samples_leaf, max_depth = self.max_depth, level = self.level + 1, parent_value = self.parent_value)
            self.leftTree.var_split(x_lhs, y[:self.split_val])
            self.rightTree = DecisionTree(min_samples_leaf = self.min_samples_leaf, max_depth = self.max_depth, level = self.level + 1, parent_value = self.parent_value)
            self.rightTree.var_split(x_rhs, y[self.split_val:])

        else :
            self.score = float('inf')
            #samples are averaged to form final prediction at leaf node
            y = [val for val in y if val != None]
            self.value = np.mean(y)
var_split() function implementation in Decision Tree
def find_better_split(self, x, y, int ind):

        x1 = x.values[:, ind]
        inds = np.argsort(x1, axis = 0)
        sorted_y, sorted_x = y[inds], x1[inds]
        rhs_count, rhs_sum, rhs_sum2  = x.shape[0], sorted_y.sum(), (sorted_y**2).sum()
        lhs_count, lhs_sum, lhs_sum2 = 0, 0., 0.
      #  find optimal value to split of this feature the tree on
        for i in range(0, x.shape[0]-self.min_samples_leaf+1):
            lhs_count, lhs_sum, lhs_sum2 = lhs_count+1, lhs_sum + sorted_y[i], lhs_sum2 + sorted_y[i]**2
            rhs_count, rhs_sum, rhs_sum2 = rhs_count-1, rhs_sum - sorted_y[i], rhs_sum2 - sorted_y[i]**2
            if i < self.min_samples_leaf - 1 or sorted_x[i] == sorted_x[i+1]:
                continue
            updated_score = ((lhs_count * stddev(lhs_count, lhs_sum2, lhs_sum)) + (rhs_count * stddev(rhs_count, rhs_sum2, rhs_sum)))/(x.shape[0])
            #updated score is the sum of standard deviations in left and right subtrees, which need to be minimized
            if updated_score < self.score :
                self.score = updated_score
                self.split_feature = x.columns[ind]
                self.split_val = i
                self.value = (np.mean(y[:i])*i + np.mean(y[i:])*(x.shape[0] - i))/(x.shape[0])
        self.score = self.score
findbettersplit() function implementation
通过寻找分割之后最大化同质性的特征,决策树递归的分成左右两个子树,这通过两个循环完成:
第一个循环遍历所有的特征,决定那个是最好的进行分割。函数 varsplit()对每一个特征调用 findbetter_split() ,看看这个特征是否能够得到最纯的叶子节点。
findbettersplit() 中的内部的循环中,为每一个特征计算最优化的分割值。
计算一个得分,也就是在不同的值上分割每个特征的信息增益。这个得分表示了分割之后的子树的多样性,需要最小化。
选出来进行分割的特征和特征的值的组合会让子树有最低的多样性,或者说最大的同质性。
通过寻找最佳的特征和最佳的分割值,树分成了左右两个子树,左树和右树的类的成员增加了。
在左树和右树成员上递归的调用 var_split()函数,找到最好的特征和最佳的分割值,继续下去,直到叶子节点的其中一个条件满足,比如说最大的深度或者是这个树已经长完了,或者数据样本没有了。
这个叶子节点的值就是所包含的所有的训练样本的均值,或者是这叶子节点所对应的值。
对测试/验证数据集做预测
 def predict(self, x):
        #averages the predictions of each of its Decision Trees
        return np.mean([t.predict(x) for t in self.trees], axis = 0)
predict() function for Random Forest
def predict(self, X):
        #append the predictions for each data sample or row by calling predict_row()
        y_pred = []
        for row in range(X.shape[0]):
            y_pred.append(self.predict_row(X.iloc[row, :]))
        return y_pred

def predict_row(self, row):
        if self.is_leaf:
            #return the value at the leaf node as a prediction for this row
            return self.value
        if row[self.split_feature] < self.split_val:
            return self.leftTree.predict_row(row)
        else:
            return self.rightTree.predict_row(row)
predict() implementation for a Decision Tree
预测结果的代码非常好理解:
随机森林的集成预测是通过对每一个独立的决策树求均值得到的。
注意:随机森林回归器的平均值预测是个很好的技术,但是对于随机森林分类器,考虑到树的预测的频率,通常选择最大频率的预测值。
在决策树内部,预测每一个样本,通过遍历树,对比特征的值,对每个level进行分割,然后走到左树或者右树,直到到达叶子节点。
对样本的预测存在叶子节点中,在训练的时候已经提前被赋值了。
解释随机森林模型
我们现在有了随机森林集成的基本的结构。我们再加一些非常有用的增强功能,特征交互和树的解释,这些对于解释随机森林是非常重要的概念。
特征重要性背后的直觉
import numpy as np

def find_feature_importances(self, X, y):
    feat_imp = {}
    y_pred_old = self.predict(X)
    for ind in range(X.shape[1]):
        X_new = X.copy()
        np.random.shuffle(X_new.values[:, ind])
        y_pred = self.predict(X_new)
        feat_imp[X.columns[ind]] = np.fabs(np.sum(y_pred_old) - np.sum(y_pred))
        del X_new
    """Keeping all other feature values constant, shuffle this feature and
    calculate the difference between the earlier results and the results using
    random values for this feature.
    A high difference denotes high feature importance."""
    features, importances =zip(*sorted(feat_imp.items(), reverse=True))
    return features, importances

RandomForest.find_feature_importances = find_feature_importances
idxs = np.random.permutation(X_train.shape[0])[:50]
features, imp = find_feature_importances(rf_mine, X_train.iloc[idxs, :], y_train[idxs])

plt.barh(features[:10], imp[:10])
为了找到一个特定的特征对于模型的预测有多少决定性,下面是一个方法:
在数据集上的预测的评估度量(准确率或者误差)记录下来。
接下来,开始决定特征的值的重要性,使用 shuffle() 进行随机的打乱。
使用shuffle之后的这个特定的特征,重新运行这个模型,对数据集进行预测,重新评估。
计算评估的结果和没有打乱之前的结果的差。
如果差别很大,结果变得很差,这个特定的特征就对模型的预测具有很大的决定性。
如果一个特征的随机打乱的值给模型带来了巨大的性能下降,我们说这个用来分割的特征在树中的位置相当的高,而且重要。在我的实现中,每个特征都会使用这种技术。
可以用条状图来可视化特征以及对于的重要性,用来解释我们的随机森林模型的不同的特征的权值。

随机森林的局部依赖绘图
局部依赖绘图对于理解特征和目标之间的关系特别的有用。是单调的上升,下降,还是不规则的?
单变量绘图 vs 局部依赖绘图
如果我们看一个典型的单变量的图,去找特征对于目标变量的作用,我们很少会发现连续的上升/下降的曲线或者直线,单变量的图往往是不规则的。
举个例子,比如你有一个房价数据集,预测房价,给你的是一组特征,包括建房年月,地点等其它特征。如果你画一个单变量的图,建房日期和,你期待的是一个连续的上升的曲线,因为房价随着建房日期应该是上升的。但是画出来的图却是在某些年之间有下降。这个可能会错误的引导你认为这些年建的房子对于房价来说是不好的年。
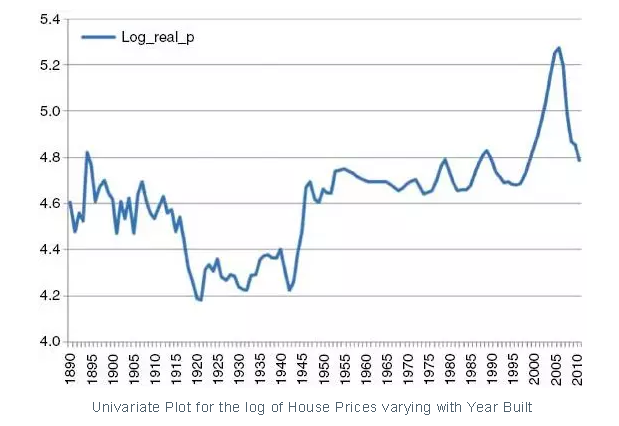
然而,可能是正好那些年买的多数的房子在一个相对便宜的地区,导致了曲线的下降。
局部依赖绘图会解决这个问题,展示房价和建房时间的真正关系,你会发现确实是持续上升的。这要归功于局部依赖绘图,我们让考虑的特征中只有一个变化,让其他的特征保持不变。这样我们去掉了其他的依赖变量的噪声,得到了一个对于每个特征和目标变量的真实的自然的解释。

局部依赖绘图的实现
我对于局部依赖绘图的实现如下:
import numpy as np
import matplotlib.pyplot as plt
def plot_pdp(self, X, y, feature_name, n_clusters = 2):
    feature_id = -1
    y_pred_vals = []
    y_pred_mean = []
    for index in range(X.shape[1]):
        if X.columns[index] == feature_name:
            feature_id = index
    X_new = X.copy()
    for feature_val in np.unique(X.values[:, feature_id]):

        X_new.values[:, feature_id] = feature_val
        y_pred_val = self.predict(X_new)

        y_pred_vals.append(y_pred_val)
    del X_new
    """keeping the values of all other features constant, find the value
    of target variable for each uniqye value of this feature"""
    y_pred_randoms = np.random.normal(y_pred_vals)[:n_clusters]
    y_pred_mean = np.mean(y_pred_vals, axis = 0)
    print("y_pred_mean: "+str(y_pred_mean))
    plt.plot(X.values[:, feature_id], y_pred_mean)
    plt.show()

RandomForest.plot_pdp = plot_pdp
idxs = np.random.permutation(X_train.shape[0])[:10]
#Plotting the partial dependence for the first feature in the dataset
plot_pdp(rf_mine, X_train.iloc[idxs, :], y_train[idxs], X_train.columns[0])保持所有其他的列(特征的值)不变,在循环里面遍历考虑所有的单个特征,运行模型对于这个特征的每个独立的值预测结果。
绘制结果值,理解这个特征和目标变量背后的趋势。
保持其他的特征不变,改变依赖的特征,是解决外部噪声问题的关键,可以描述特征和目标的关系。
随机森林的树解释器
有一个非常有用的技术可以解释随机森林的流程,就是通过每个决策树的树解释器。
A very useful technique of explaining the flow of Random Forest predictions is through using Tree Interpreters for each of the Decision Trees.
class TreeInterpreter:

    def predict(self, rf_model_tree, row):
            prediction , bias, contribs = rf_model_tree.predict_row_for_ti(row, {})
            print('prediction: '+str(prediction)+"bias: "+str(bias)+" contributions: "+str(contribs))

return prediction, bias, contribs树的根节点的值(也就是所有训练数据的平均值)叫做偏差。
树解释器中的predict()函数调用了决策树中的predictrowfor_ti() 函数,预测了单个数据样本的结果。
对于每个分割,用来做分割的特征的分布使用分成子树之后样本的多样性的均值的数量来计算。
特征的分布存在一个数组中,直到叶子节点,结果返回给树解释器。
在叶子节点,样本的预测值返回,同时返回的还有偏差和贡献,也就是每个特征对于最终结果的贡献。
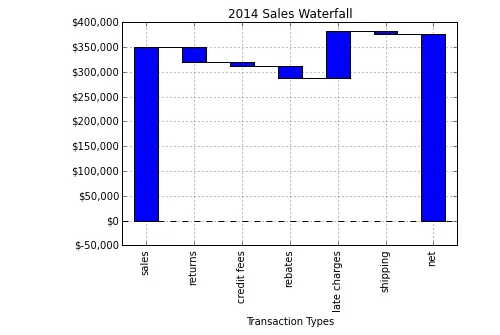
ti = TreeInterpreter()
pr, bias, contribs  = ti.predict(rf_mine.trees[0], X_valid.iloc[0, :])

#Waterfall Chart based on Tree Interpreter
from waterfall import waterfall_chart
waterfall_chart.plot(list(contribs.keys()), list(contribs.values()))
基于树解释器的瀑布图
每个特征到达叶子节点后的贡献可以通过瀑布图来可视化,使用python中的waterfall工具。
瀑布图是一个非常有效的方法来可视化每个特征的贡献,从根节点到每个叶子节点。
def predict_row_for_ti(self, row, feat_contribs):

        if self.is_leaf:
           return self.value, self.parent_value , feat_contribs
        if row[self.split_feature] < self.split_val:
            if self.split_feature in feat_contribs.keys():
                feat_contribs[self.split_feature] += self.leftTree.value - self.value
            else:
                feat_contribs[self.split_feature] = self.leftTree.value - self.value
            return self.leftTree.predict_row_for_ti(row, feat_contribs)
        else:
            if self.split_feature in feat_contribs.keys():
                feat_contribs[self.split_feature] += self.rightTree.value - self.value
            else:
                feat_contribs[self.split_feature] = self.rightTree.value - self.value
            return self.rightTree.predict_row_for_ti(row, feat_contribs)
 、
、
功能增强
这个随机森林的库还有几个需要增强的地方:
构建树解释器,需要对随机森林做特征的相关性,找到频繁的进行分割的特征组,这些也许有高的相关性。
这个是第二种探索随机森林特征交互的方法,第一种方法是局部依赖绘图,可以扩展到超过一个特征。
注意:标准的机器学习库在速度和效率上是高度优化的,因此,你写的所有的代码需要通过Cython来运行,来获取更快的速度。你需要在代码的前面加上 ‘%%cython’ 。
最后的一些想法和本文重点
从头写一个机器学习的算法,这是一个很好的开始,可以帮助理解一些很有用的python库,包括Numpy和加速数学计算,Matplotlib进行数据可视化。
完整的实现在这里:https://github.com/SonaliDasgupta/MLandAIAlgorithmsFromScratch,代码进行了进一步的优化,我还在继续优化,欢迎大家提建议。
这对我是非常有趣的练习,我希望你可以对随机森林钻研的更深,理解这并不是什么复杂的“黑盒子”。


评论专区